Japanese Universities

About
This Power BI project was used to glean some insights about Japanese universities. The dataset was obtained from Kaggle. This dataset contains some information about code, name, Japanese name, type, Japanese type, address, postal code, phone, state, Japanese state, latitude, longitude, found, count of faculty, count of department, has graduated, has remote, review rating, review count, difficulty SD, and difficulty rank.
Techniques
- Understanding and Brainstorming
- Data Cleaning
- Data Visualization
Understanding what each column stands for and what can be gained from this dataset. Take note of what will be done and what analysis will be carried out.
Dataset cleaning included removing some unused columns.
Based on what has already been done from previous steps, choose data and visualization types to create the dashboard. Customize the visual to get better visualization.
Insights
- Japanese Universities
- First found university
- Top 10 universities by rating
- Top 10 states by count of universities
- Top 10 universities by count of department
- Percentage universities with remote
- Count of universities by rank
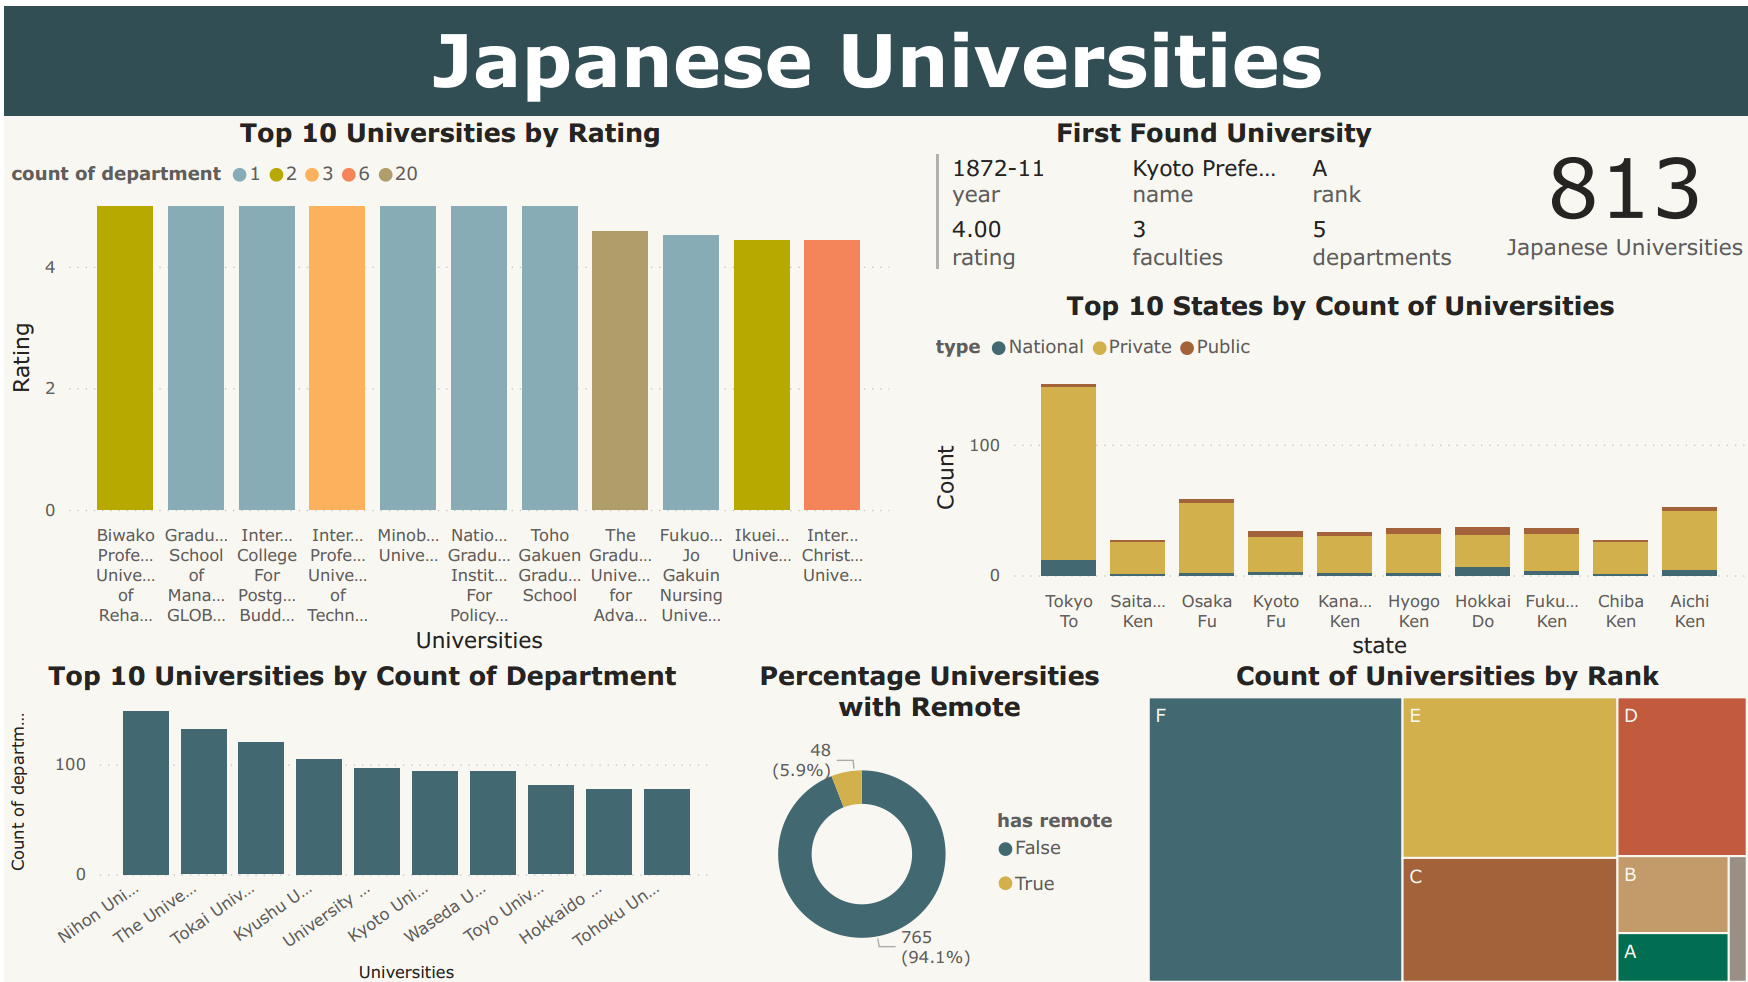
Card visualization to show how many universities are in Japan.
The multi-row card showed detailed information about the first found university, including the year found, name of university, rank, rating, count of faculties, and count of departments.
Bar chart visualized the top 10 universities with the highest ratings. There is also legend to see how many departments for each university.
Stacked bar chart was used to reveal the top 10 states with the most universities and detailed information about the types of universities. This bar chart also has a drill down about the rank of universities for each bar.
Bar chart showed about top 10 universities that had the highest count of departments.
Donut chart was divided based on the percentage of universities that had remote study. Most universities don’t have remote study.
Tree map divided rectangle into 7 parts based on the count of universities based on rank. Rank S, the highest rank has the lowest count of universities. While rank F, the lowest rank has the most number of universities.